

Managed Services
Monitoring and Alarm Management
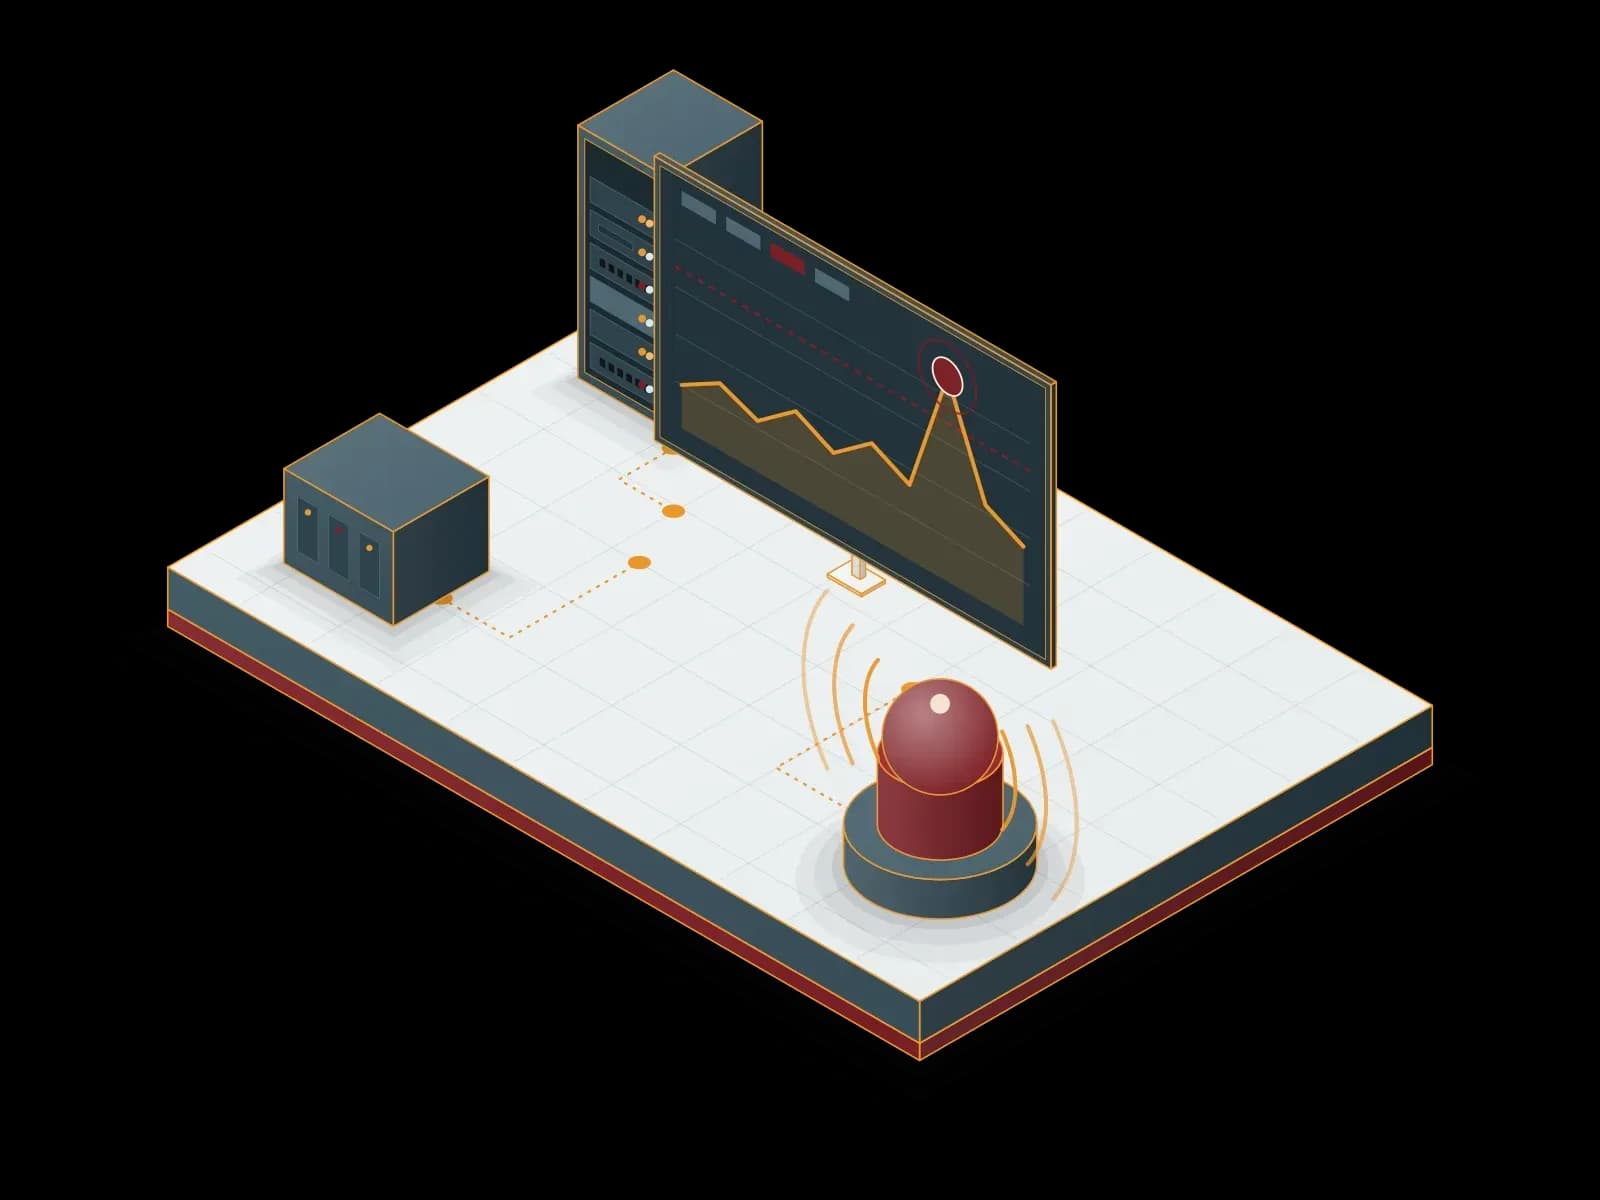
We monitor your servers, network devices and applications with Zabbix, Prometheus and Grafana, agree on alarm rules with you and respond to alarms.
Benefits of Monitoring and Alarm Management
Continuous Monitoring
We collect server, network device and application metrics continuously. An alarm fires when a threshold is crossed.
Custom Alarm Settings
We agree with you on thresholds and alarm channels based on your business needs.
Reporting
We prepare periodic capacity and availability reports from the monitoring data.
Integration
We forward alarms to email, a chat application or a ticketing system.
Scalable Setup
We add new servers and devices with monitoring templates. Monitoring coverage grows with your infrastructure.
24/7 Monitoring and Support
Our support line is available 24/7. When an alarm arrives, our team examines the cause and responds.
Preventive Maintenance
We watch trends such as disk usage and resource consumption and suggest action before a problem grows.
Security
We restrict access to the monitoring server to authorized users and encrypt agent connections.


Monitoring with Zabbix, Prometheus and Grafana
We set up and operate your monitoring with Zabbix, Prometheus and Grafana. We select the tools with you, based on your current systems and the way your team works.
What do we monitor?
We monitor servers, virtual machines, network devices, databases, application services and web addresses. Zabbix collects data with its own agent and with SNMP, IPMI and SSH. Prometheus collects system and application metrics as time series.
Alarm management
We set the thresholds and alarm rules with you. Zabbix detects problems in the incoming metrics and sends alarms to channels such as email, Slack or PagerDuty. On the Prometheus side, Alertmanager handles the alarms. When an alarm comes in, our support team examines the cause and acts on it.
Dashboards and reporting
With Grafana, we show metrics and logs on dashboards. Grafana connects to data sources such as Prometheus, Zabbix and SQL databases through plugins. We prepare separate dashboards and periodic reports for the technical team and for management.
Technologies we use
 Zabbix
 Prometheus
 Grafana
Related services
SIEM – SOC Management
We collect your system logs in a SIEM platform, monitor security events with our SOC team and pass verified incidents on to you.
Operating System Management
We install, update, monitor and back up your Windows Server and Linux servers. We apply security patches in planned maintenance windows.
Database Management
We manage, back up, monitor and tune your MySQL, MariaDB, PostgreSQL, Microsoft SQL Server and Elasticsearch databases.
Let's discuss your project
Tell us what you need and we will match you with the right team. For urgent issues, call our support line.