

AI and Automation
Data Visualization and Power BI Consulting
We turn your data into Power BI reports and dashboards. We connect the data sources, prepare the data with Power Query and build the data model with DAX. We share reports securely with row-level security, a data gateway and scheduled refresh. We also help you choose the right licenses.

What is Power BI?
Power BI is Microsoft's business analytics platform. It connects data from different sources, models it and shares it in interactive reports and dashboards. According to Microsoft, Power BI is a core component of Microsoft Fabric.
Power BI has two main components. Power BI Desktop is the Windows application for building reports and data models. The Power BI service is the cloud service where reports are published, shared and refreshed on a schedule. Users also view reports on phones and tablets with the Power BI Mobile apps.
Scope of our Power BI consulting
Reports and dashboards
We build summary dashboards for management and detailed reports for teams. We configure filters, drill-down and the mobile layout.
Data preparation
With Power Query we clean and combine data from different sources and turn the steps into refreshable queries.
Data model and DAX
We create the relationships between tables and write DAX measures. Examples: year-over-year growth, budget versus actual.
Secure sharing
With row-level security (RLS) and workspace roles, each user sees only the data they are authorized to see.
Scheduled refresh
We install the gateway and configure the refresh schedule and the failure notifications.
Training
We train your report users and the team that builds the reports.


How we work with Power BI
1. Connect the data sources
According to Microsoft, Power BI Desktop connects to more than 100 data sources. They include databases, Excel files, cloud services and web sources.
2. Prepare the data
We clean and transform the data with Power Query. Power Query saves the transformation steps as a refreshable query, so the same preparation runs again at every refresh.
3. Build the data model
We create the relationships between tables and write measures and calculated columns in DAX (Data Analysis Expressions). Examples: year-over-year growth, budget versus actual, stock turnover.
4. Design the reports
We design the summary dashboard and the detailed report separately for each audience. We configure filters, drill-down and the mobile layout.
5. Publish and share
We publish the report to the Power BI service and distribute it to users through workspaces and apps.


Storage modes and data refresh
A Power BI semantic model works in different modes. In Import mode, the data is copied into the model and updated by scheduled refresh. In DirectQuery mode, Power BI does not copy the data; it sends every query to the source system. In Live connection mode, the report connects to an external model such as Analysis Services.
According to Microsoft, a semantic model on shared capacity refreshes on a schedule at most 8 times a day. On Premium capacity, Premium Per User (PPU) or Fabric capacity, the limit is 48 refreshes a day. We choose the mode and the refresh frequency by data volume and by how current the report must be.
Access to on-premises data: the gateway
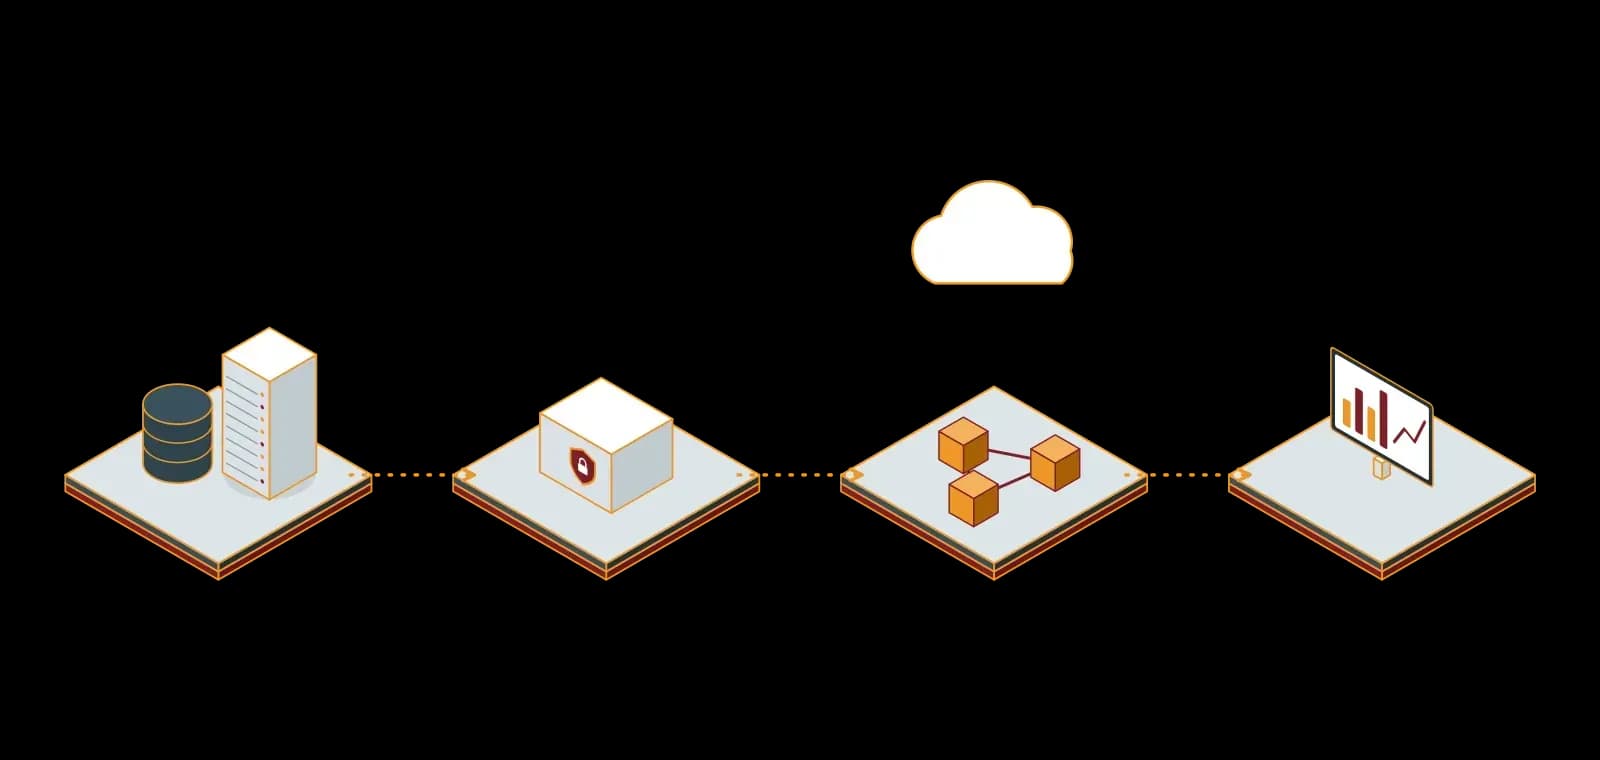
The Power BI service cannot access on-premises databases that are not exposed to the internet. For these sources we install an on-premises data gateway. According to Microsoft, the gateway is locally installed Windows software that uses outbound connections only. You do not need to open inbound ports in your network.
Standard mode
For centrally managed connections that several users share. It supports DirectQuery connections and gateway clusters for high availability.
Personal mode
For one user who refreshes their own Import models. It cannot be shared with other users.
Virtual network (VNet) data gateway
Connects to data sources in a virtual network. Microsoft manages this service and it needs no local installation.


For business use we recommend standard mode. We connect the gateway server to the monitoring system and plan its updates.
Row-level security (RLS)
Row-level security lets each user of the same report see only the rows they are authorized to see. Example: a regional manager sees only the sales of their own region. We define the roles and filters in Power BI Desktop with DAX expressions. We assign users to the roles in the Power BI service and validate the filter with the Test as role feature before release.
According to Microsoft, RLS applies only to users with Viewer permission. It does not apply to the Admin, Member and Contributor roles of the workspace. For this reason we plan the workspace roles together with the RLS design.
Power BI licenses
According to Microsoft, Power BI has three per-user license types: Fabric (Free), Power BI Pro and Power BI Premium Per User (PPU). In addition, there are capacity licenses at organization level: Fabric F SKUs or Power BI Premium P SKUs.
Free
The user creates reports for their own use only. They cannot use the sharing and collaboration features.
Pro
The user publishes content and shares it with other Pro users.
Premium Per User (PPU)
Adds most Premium capacity features per user on top of the Pro capabilities. Only users with a PPU license see the content in a PPU workspace.
Capacity
When the content is in a workspace on Fabric F64 or larger, or on Premium capacity, users with a Free license can also view it.


The right license depends on how many people build and view reports and how they share them. We define the license combination with you, based on your user structure.
Power BI with Synchron
Needs analysis
We define which decision the report supports, who uses it and which data sources it needs.
Data preparation and model
We write the Power Query queries and DAX measures and document the model.
Report and dashboard design
We build reports that follow your corporate colors and layout rules.
Security
We configure RLS roles, workspace permissions and sharing rules.
Infrastructure
We install the gateway and configure scheduled refresh and failure notifications.
Improving existing reports
For a slow report we find the bottleneck with the Performance Analyzer and rework the model and DAX measures.
Training
We train your report users and the team that builds the reports.


If the data must first be collected in a database, we work together with our Database Management service. We automate recurring data transfers with n8n. For your Power BI project, write to us through the contact form.
Technologies we use
 Power BI
 n8n
n8n

Frequently asked questions
What is Power BI and why should I use it?
Power BI is Microsoft's business analytics platform. It combines data from different sources in one model and shares it in interactive reports and dashboards. Instead of merging Excel files by hand, reports refresh on a schedule and everyone looks at the same data.
What do our Power BI services cover?
Our services cover needs analysis, data preparation (Power Query), data models and DAX measures, report and dashboard design, row-level security, gateways and scheduled refresh, improvement of existing reports and training.
Which industries and companies is it suitable for?
It suits every organization that collects data from more than one source and makes regular decisions with that data. Sales, stock, cost, finance and operations reports are the most common uses.
Which data sources can I integrate with Power BI?
According to Microsoft, Power BI Desktop connects to more than 100 data sources. They include databases, Excel files, cloud services and web sources. For on-premises sources that are not exposed to the internet, we install a data gateway.
Can I analyze data in real time?
In DirectQuery mode, the report reads the data from the source system at every query and shows current data. In Import mode, the data is updated by scheduled refresh: at most 8 times a day on shared capacity, and at most 48 times a day on Premium, PPU or Fabric capacity. We choose the mode by data volume and by how current the data must be.
Can I move my existing reports to Power BI?
Yes. We review the Excel sheets and SQL queries and rebuild the calculations with Power Query and DAX. After the move we validate the results against the old report.
How can I benefit from Power BI services?
Write to us through the contact form. In the first meeting we discuss your reporting needs and data sources. We recommend starting with one pilot report.
Which license does Power BI need?
Users who publish and share reports need a Power BI Pro or Premium Per User (PPU) license. When the content is in a workspace on Fabric F64 or larger, or on Premium capacity, users with a Free license can also view the report. We define the combination based on your number of users.
How does Power BI connect to our on-premises database?
We install an on-premises data gateway. The gateway is locally installed Windows software that uses outbound connections only. For this reason you do not need to open inbound ports in your network.
Can users see only their own data in a report?
Yes. With row-level security (RLS), each user sees only the rows they are authorized to see. We define the roles with DAX and test them before release. RLS applies to users with Viewer permission in the workspace.
Related services

AI Solutions: Enterprise Assistant, RAG and AI Agents
We connect large language models (LLMs) to your business processes: an enterprise assistant, RAG solutions that search your documents, and AI agents that run with n8n. Every project starts with data security and data protection.

n8n Consultancy
We automate your business processes with n8n. We install n8n on your own server or configure your n8n Cloud account. We design the workflows, connect your systems through APIs and put AI agents into service. After deployment we keep n8n running with updates, backups and monitoring.

Database Management
We manage, back up, monitor and tune your MySQL, MariaDB, PostgreSQL, Microsoft SQL Server and Elasticsearch databases.
Let's discuss your project
Tell us what you need and we will match you with the right team. For urgent issues, call our support line.